
Introduction: When Data Exists but Clarity Does Not
Modern organizations generate an enormous amount of data every single day. Sales activities, customer interactions, service requests, and marketing campaigns all leave a digital footprint.
However, despite this abundance of information, executives still find themselves asking a simple question:
“What is actually happening in the business right now?”
At first, this may sound surprising. Yet in practice, it happens more often than most organizations would like to admit.
Reports arrive from different departments. Some come in spreadsheets, while others appear in presentations. Meanwhile, numbers occasionally conflict. A marketing report might suggest one outcome, whereas a sales report points in another direction.
As a result, executives begin digging into the data themselves. Unfortunately, this process consumes valuable time time that should be spent making decisions rather than verifying information.
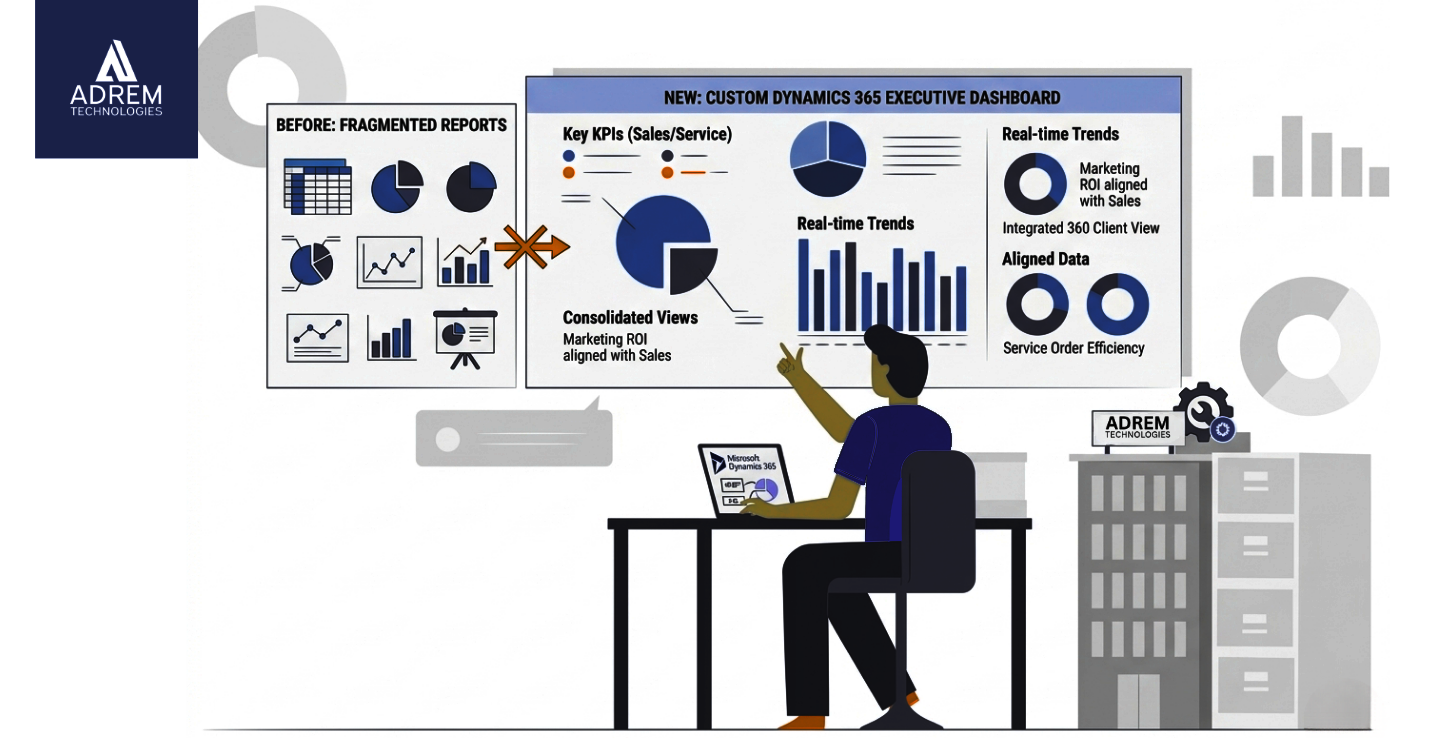
This is precisely where custom dashboards in Microsoft Dynamics 365 become essential.
Instead of navigating multiple reports, leadership teams can access a single, unified view of business performance. Consequently, they see what is working, what needs attention, and where opportunities exist—instantly.
Organizations often work with partners like Adrem Technologies to build these tailored reporting environments. Their approach ensures that systems align with real business workflows rather than forcing teams to adapt to rigid software structures.
Why Executive Reporting Needs Clarity
Executives rarely need operational detail. Instead, they need perspective.
- They want to identify patterns
- They need to understand trends
- They look for reassurance that the business is moving in the right direction
However, traditional reporting methods make this difficult.
On one hand, teams manually collect data from multiple systems. On the other hand, reports often arrive too late to support timely decisions. As a result, leadership operates with delayed or inconsistent information.
Custom dashboards solve this problem by delivering real-time, high-level insights in a clear and structured format.
Benefits of Custom Dashboards for Executive Reporting
When dashboards are designed around leadership needs, the benefits become immediately visible.
| Benefit | What It Means | Practical Result |
|---|---|---|
| Real-time visibility | Data updates automatically | Leaders see current performance |
| Centralized reporting | All metrics in one place | Reduced confusion |
| Visual insights | Charts simplify data | Faster understanding |
| Consistent metrics | Unified numbers across teams | Better alignment |
Therefore, organizations invest in dashboards not because they look impressive, but because they reduce complexity and save time.
What Dynamics 365 Custom Dashboards Actually Do
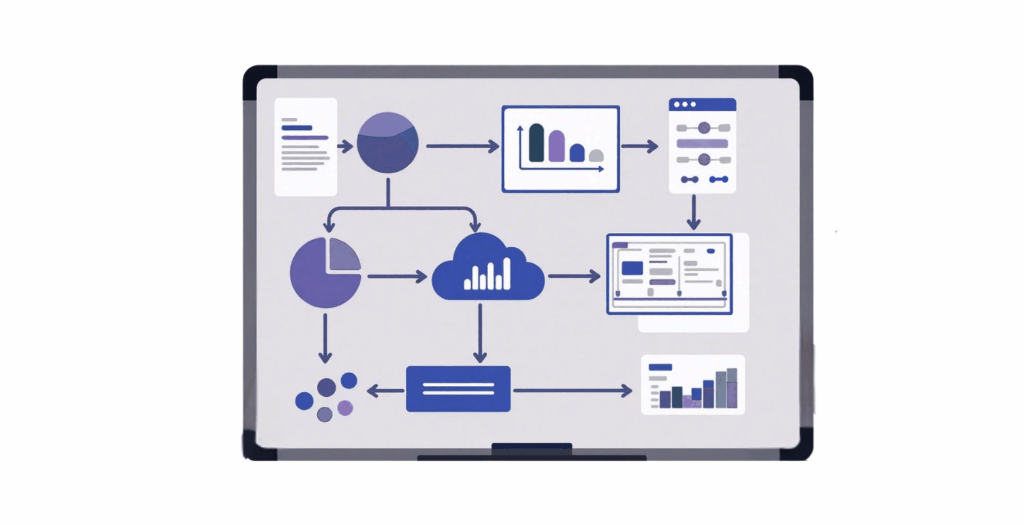
At their core, Dynamics 365 custom dashboards transform raw data into meaningful visual summaries.
Typically, dashboards include:
- Sales pipeline performance
- Revenue trends
- Customer satisfaction metrics
- Service response times
- Marketing campaign results
Individually, these metrics provide limited insight. However, when combined, they present a complete picture of business performance.
As a result, leadership meetings change significantly. Instead of explaining numbers, teams focus on actions and strategy.
Why Real-Time Data Matters for Executives
Business environments evolve quickly. For example:
- Customer demand shifts
- Competitors enter the market
- Campaign performance fluctuates
Therefore, relying on outdated reports creates risk.
Real-time dashboards allow executives to:
- Monitor performance continuously
- Detect trends early
- Compare departments instantly
- Adjust strategy proactively
In other words, decisions become timely rather than reactive.
Key Metrics in Executive Dashboards
Effective dashboards avoid unnecessary complexity. Instead, they focus on a carefully selected set of KPIs.
Common metrics include:
- Revenue performance
- Sales pipeline value
- Lead conversion rates
- Customer satisfaction scores
- Service response time
- Operational productivity
Example: Executive Dashboard Metrics
| Business Area | Example Metrics | Purpose |
|---|---|---|
| Sales | Revenue growth, pipeline value | Track sales health |
| Marketing | Lead generation, campaign ROI | Measure effectiveness |
| Customer Service | Resolution time, CSAT | Evaluate service quality |
| Operations | Task completion rates | Monitor efficiency |
These metrics help leaders move from data overload to actionable insight.
CRM Performance Dashboards and Customer Insights
CRM systems store valuable customer data. However, raw data can feel overwhelming without structure.
CRM dashboards simplify this by organizing insights into a clear format.
For example:
- Sales leaders track deal progress
- Support teams monitor response times
- Marketing teams evaluate campaign performance
As a result, leadership discussions become more focused and productive.
Strategic Planning Becomes More Accurate
Strategic decisions require reliable data. Without it, leaders rely on assumptions.
Custom dashboards support planning by highlighting:
- Performance trends over time
- Departmental comparisons
- Early warning signals
- Growth opportunities
For instance, a slight drop in conversion rates becomes visible immediately. Consequently, teams can act before the issue escalates.
Why Customization Matters in Microsoft Dynamics 365
Every organization operates differently.
- Manufacturing focuses on production efficiency
- Retail tracks sales and inventory
- Consulting emphasizes project delivery
Therefore, standard dashboards rarely meet all needs.
Customization allows businesses to:
- Include industry-specific metrics
- Integrate multiple systems
- Design role-based dashboards
- Align reporting with strategy
Partners like Adrem Technologies help organizations achieve this by tailoring Dynamics 365 to real operational requirements.
Key Features of Effective Executive Dashboards
A strong dashboard prioritizes simplicity and usability.
Essential features include:
- Role-based views for different executives
- Interactive charts for deeper insights
- Automatic data updates
- Mobile accessibility
As a result, dashboards remain practical tools rather than static reports.
Challenges Without Custom Dashboards
Organizations relying on traditional reporting often face:
- Delayed information
- Conflicting reports
- Time-consuming analysis
- Reduced decision speed
Over time, these inefficiencies impact performance.
In contrast, dashboards eliminate these issues by providing a single, reliable source of truth.
Implementation Considerations
Successful dashboard implementation requires planning.
Key steps include:
- Defining relevant KPIs
- Integrating systems (CRM, ERP, etc.)
- Validating data accuracy
- Training leadership teams
Working with experienced partners such as Adrem Technologies often ensures smoother implementation.
Example Dashboard Structure
| Section | Key Metrics | Purpose |
|---|---|---|
| Financial Overview | Revenue, profitability | Business health |
| Sales Performance | Pipeline, conversions | Sales effectiveness |
| Customer Experience | CSAT, response time | Customer insights |
| Operations | Productivity metrics | Efficiency tracking |
This structure provides a balanced, high-level view.
Conclusion
Data has become one of the most valuable assets in modern organizations. However, its true value appears only when leaders can interpret it quickly and confidently.
Custom dashboards in Microsoft Dynamics 365 bridge this gap.
By transforming complex data into clear, visual insights, they enable executives to:
- Make faster decisions
- Improve alignment across teams
- Focus on strategy instead of analysis
Organizations that adopt these dashboards often notice subtle but important changes. Meetings become shorter. Discussions become more focused. Decisions become more confident.
With support from partners like Adrem Technologies, businesses can turn fragmented data into structured intelligence.
Ultimately, dashboards do something simple yet powerful:
They give leaders clarity.
And in many cases, clarity is exactly what drives better business outcomes.
Frequently Asked Questions
They are tailored visual interfaces that display key business metrics and insights within Microsoft Dynamics 365.
Because dashboards present complex data visually, making it easier to understand performance quickly.
They organize customer and sales data into actionable insights for better decision-making.
Yes. Dynamics 365 dashboards can combine data from CRM, ERP, and other platforms.
In most cases, yes. Customization and integration require technical expertise, which partners like Adrem Technologies provide.
